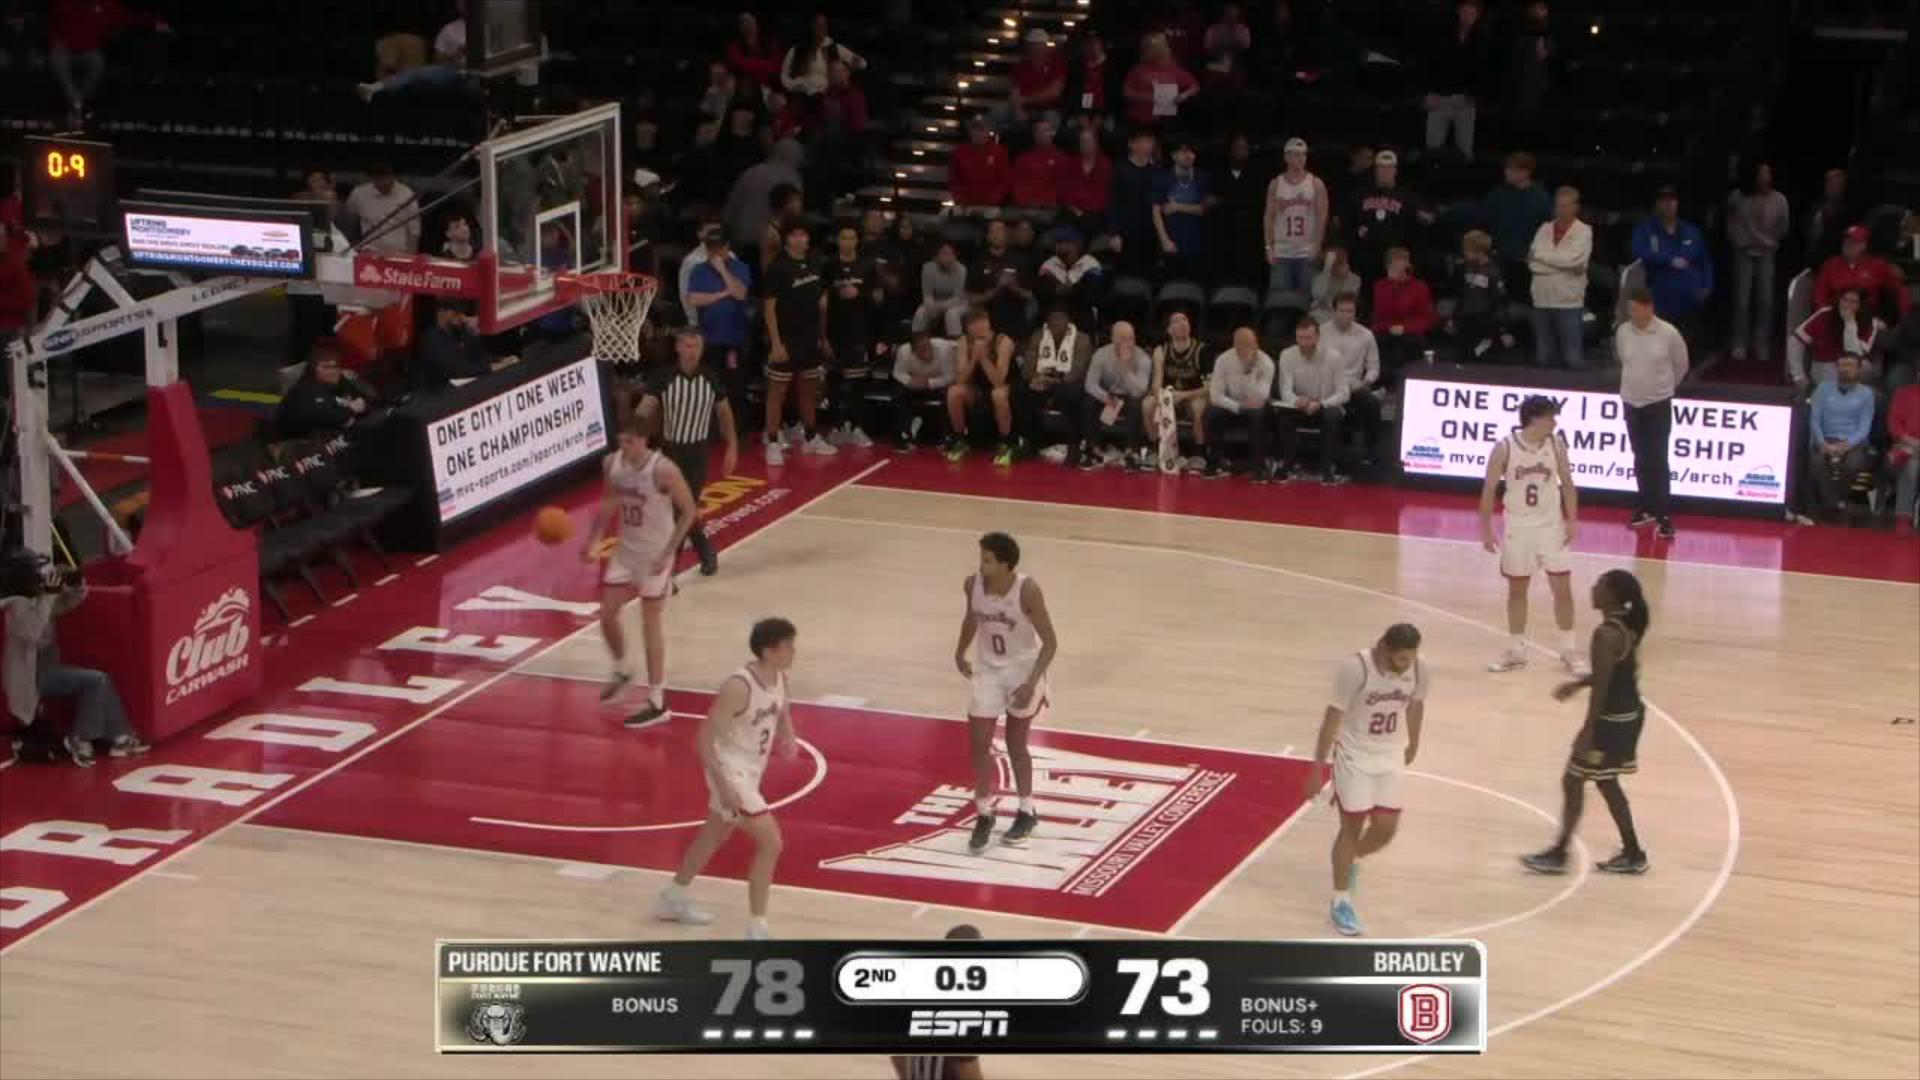
Typical final
BRAD 63, PAC 75
Spread and total: game
BRAD +10.557%43%PAC -10.5
BRAD +9.553%47%PAC -9.5
BRAD +8.549%51%PAC -8.5
BRAD +7.545%55%PAC -7.5
BRAD +6.541%59%PAC -6.5
O 126.561%39%U 126.5
O 128.556%44%U 128.5
O 130.550%50%U 130.5
O 132.545%55%U 132.5
O 134.539%61%U 134.5
1st half (score at halftime)
BRAD +5.556%44%PAC -5.5
BRAD +4.552%48%PAC -4.5
BRAD +3.548%52%PAC -3.5
BRAD +2.544%56%PAC -2.5
BRAD +1.540%60%PAC -1.5
O 61.568%32%U 61.5
O 63.561%39%U 63.5
O 65.552%48%U 65.5
O 67.544%56%U 67.5
O 69.536%64%U 69.5
Centered on the market line (shaded), shaped by 10,000 simulated games.
| Players to watch | PTS | REB | AST | Chance |
|---|
| PACAdriel Nyorha | 14.6 | 5.1 | 3.7 | 15+ 48% |
| PACJaden Winston | 12.7 | 2.1 | 2.8 | 15+ 35% |
| PACJaion Pitt | 11.9 | 5.6 | 2.2 | 15+ 28% |
| BRADTrevon Payton | 10.6 | 2.3 | 2.0 | 10+ 56% |
| PACCJ Jones | 9.3 | 3.7 | 3.3 | 10+ 46% |
| PACJaylen Thompson | 8.2 | 3.5 | 0.6 | 10+ 36% |
Bradley simulated box score
| Player | MIN | PTS | REB | AST | STL | BLK | TO | FG | 3PT | FT |
|---|
| Trevon Payton | 28 | 10.6 | 2.3 | 2.0 | 1.2 | 0.1 | 1.8 | 3.7-10.3 | 1.8-6.1 | 1.4-1.9 |
| Noah Williams | 27 | 7.7 | 4.3 | 0.2 | 0.6 | 0.5 | 1.2 | 2.5-6.8 | 0.9-3.3 | 1.9-2.6 |
| Ben Thornbrue | 24 | 8.0 | 2.9 | 0.9 | 0.8 | 1.0 | 0.7 | 2.6-6.8 | 0.8-3.0 | 2.0-2.8 |
| Max Gaspa | 22 | 6.4 | 1.7 | 2.0 | 0.4 | 0.0 | 2.5 | 2.1-6.2 | 1.1-4.0 | 1.1-1.5 |
| Xander Alarie | 20 | 6.7 | 4.6 | 0.9 | 1.2 | 1.2 | 1.8 | 2.3-5.9 | 0.5-1.8 | 1.5-2.2 |
| Timoty van der Knaap | 18 | 5.8 | 3.7 | 0.2 | 0.9 | 0.2 | 1.2 | 2.1-5.9 | 0.6-2.2 | 1.0-1.4 |
| Kyle Grill | 17 | 4.3 | 2.0 | 1.7 | 0.4 | 0.0 | 0.7 | 1.3-3.7 | 0.5-1.7 | 1.2-1.7 |
| Jackson Seastrunk | 15 | 5.1 | 1.8 | 2.1 | 0.6 | 0.0 | 0.2 | 1.9-5.3 | 0.7-2.6 | 0.6-0.9 |
| Josh Ibukunoluwa | 14 | 4.5 | 3.8 | 0.7 | 0.8 | 0.5 | 0.8 | 1.8-4.4 | 0.4-1.3 | 0.6-0.9 |
| Dimitrije Pavlovic | 6 | 1.1 | 0.0 | 0.4 | 0.2 | 0.0 | 0.5 | 0.4-1.2 | 0.2-0.7 | 0.1-0.1 |
| Gustavo Guimares | 6 | 1.4 | 1.8 | 0.5 | 0.0 | 0.0 | 0.2 | 0.5-1.3 | 0.1-0.2 | 0.3-0.4 |
| Dietrich Richardson | 4 | 1.3 | 1.1 | 0.4 | 0.8 | 0.0 | 0.5 | 0.5-1.4 | 0.1-0.5 | 0.1-0.1 |
| Team | 200 | 62.9 | 30.0 | 12.0 | 7.9 | 3.5 | 12.1 | 21.7-59.2 | 7.7-27.4 | 11.8-16.5 |
Pacific simulated box score
| Player | MIN | PTS | REB | AST | STL | BLK | TO | FG | 3PT | FT |
|---|
| Adriel Nyorha | 33 | 14.6 | 5.1 | 3.7 | 0.7 | 0.2 | 2.0 | 5.3-12.3 | 2.0-5.7 | 1.8-2.5 |
| Gavin Ripp | 27 | 6.1 | 7.5 | 1.9 | 1.2 | 0.2 | 1.1 | 2.4-4.9 | 0.3-0.8 | 1.0-1.4 |
| Jaden Winston | 27 | 12.7 | 2.1 | 2.8 | 1.9 | 0.2 | 2.5 | 4.1-9.8 | 1.7-5.0 | 2.7-3.6 |
| CJ Jones | 27 | 9.3 | 3.7 | 3.3 | 0.5 | 0.8 | 2.6 | 3.7-8.7 | 1.3-3.9 | 0.6-0.9 |
| Jaion Pitt | 26 | 11.9 | 5.6 | 2.2 | 0.8 | 1.0 | 1.5 | 4.5-9.0 | 0.6-1.8 | 2.2-3.3 |
| Jaylen Thompson | 22 | 8.2 | 3.5 | 0.6 | 1.2 | 0.2 | 1.0 | 2.7-6.3 | 1.0-2.9 | 1.7-2.4 |
| Jacob McFarland | 11 | 2.9 | 4.1 | 0.0 | 0.2 | 0.9 | 0.5 | 1.3-2.5 | 0.1-0.2 | 0.3-0.5 |
| Dominick Harris | 11 | 4.1 | 1.0 | 0.4 | 0.0 | 0.0 | 0.8 | 1.4-3.3 | 0.6-1.8 | 0.8-1.1 |
| Jorge Carot | 9 | 1.6 | 3.7 | 0.0 | 0.2 | 0.0 | 0.6 | 0.7-1.4 | 0.0-0.1 | 0.1-0.2 |
| Damarion Vann-Kelly | 8 | 3.5 | 1.8 | 0.4 | 0.6 | 0.0 | 0.3 | 1.3-2.9 | 0.4-1.2 | 0.5-0.7 |
| Team | 200 | 74.9 | 38.1 | 15.3 | 7.3 | 3.5 | 12.9 | 27.4-61.1 | 8.0-23.4 | 11.7-16.6 |
Every possession played out from each team's shooting, turnovers, rebounding and pace and each player's minutes and usage, 10,000 times. Early season: leans on last season until teams have a few weeks of games.
Embed this Sim on your site


 BRADPAC















 W Illinois1-559
 Mercyhurst1-559Live: 0:56 - 2nd
VA Lynchburg37
 James Madison3-2122Live: 5:19 - 2nd
Calumet40
 Purdue FW3-278Live: 8:43 - 2nd
 Stony Brook2-244
 Saint Peter's0-537Live: 14:12 - 2nd
 Cornell2-364
 Morgan St4-249Live: 8:54 - 2nd
 Little Rock2-339
 North Florida2-353Live: 20:00 - 2nd
 Navy4-253
 Rider1-550Live: 9:29 - 2nd
PSU Behrend47
 Colgate1-471Live: 7:22 - 2nd
 New Mexico3-143
 Wichita St4-144Live: 14:14 - 2nd
 Fordham4-152
 Portland4-235Live: 15:07 - 2nd