Typical final
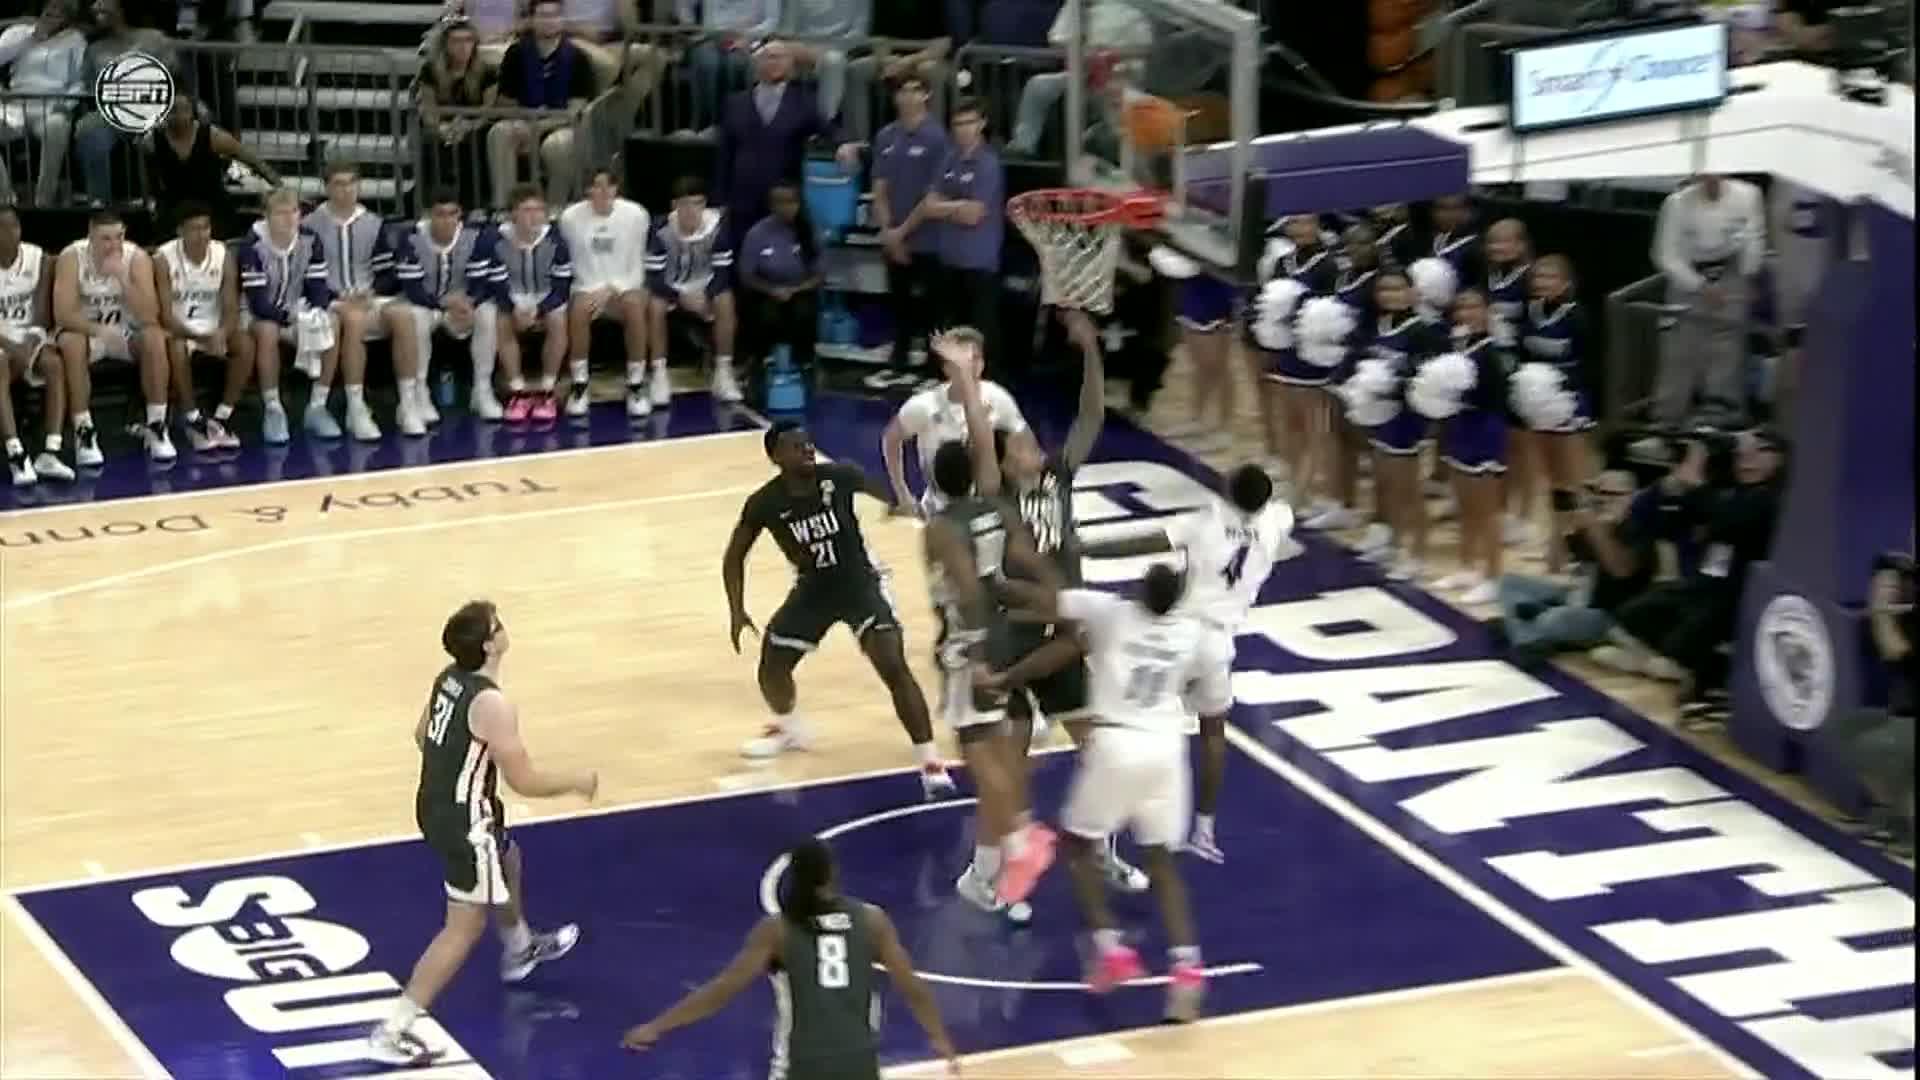
WSU 69, DUQ 81
| Players to watch | PTS | REB | AST | Chance |
|---|
| DUQTarence Guinyard | 17.9 | 5.3 | 4.1 | 20+ 38% |
| DUQJosh Smith | 17.8 | 4.9 | 1.5 | 20+ 37% |
| WSURonnie Harrison | 16.3 | 7.3 | 2.5 | 20+ 28% |
| DUQYoav Berman | 14.3 | 7.0 | 3.2 | 15+ 46% |
| WSUFraser Roxburgh | 12.6 | 9.3 | 1.8 | 15+ 34% |
| WSUSebastian Akins | 8.3 | 2.0 | 3.3 | 10+ 37% |
Washington St simulated box score
| Player | MIN | PTS | REB | AST | STL | BLK | TO | FG | 3PT | FT |
|---|
| Fraser Roxburgh | 40 | 12.6 | 9.3 | 1.8 | 0.6 | 0.6 | 1.8 | 5.1-12.0 | 1.5-4.2 | 0.9-1.3 |
| Ronnie Harrison | 38 | 16.3 | 7.3 | 2.5 | 1.7 | 1.4 | 2.8 | 5.8-13.6 | 1.7-4.9 | 3.0-4.2 |
| Ladji Dembele | 26 | 6.8 | 4.2 | 0.2 | 0.7 | 0.1 | 2.1 | 2.7-6.6 | 1.0-2.8 | 0.3-0.5 |
| Sebastian Akins | 20 | 8.3 | 2.0 | 3.3 | 1.3 | 0.1 | 0.8 | 3.1-7.9 | 1.1-3.3 | 1.0-1.4 |
| Tyler Kropp | 15 | 3.5 | 3.3 | 0.3 | 0.5 | 0.2 | 1.7 | 1.4-3.4 | 0.4-1.1 | 0.4-0.5 |
| Jamari Phillips | 15 | 5.7 | 0.8 | 0.3 | 1.0 | 0.0 | 0.9 | 1.9-5.0 | 1.1-3.1 | 0.8-1.1 |
| Jaylen Harrell | 11 | 4.5 | 1.5 | 1.1 | 0.7 | 0.0 | 0.9 | 1.7-4.0 | 0.7-1.9 | 0.3-0.5 |
| RJ Jones | 9 | 2.9 | 0.9 | 2.5 | 0.0 | 0.0 | 1.1 | 1.1-2.6 | 0.6-1.5 | 0.3-0.4 |
| Lazerek Houston | 5 | 2.6 | 0.4 | 0.4 | 0.2 | 0.0 | 0.1 | 0.8-1.9 | 0.4-1.0 | 0.7-0.9 |
| Dominik Robinson | 5 | 1.7 | 0.8 | 0.7 | 0.2 | 0.3 | 0.2 | 0.7-1.6 | 0.2-0.6 | 0.1-0.2 |
| Brayden Kyman | 5 | 1.5 | 0.0 | 0.0 | 0.0 | 0.0 | 0.3 | 0.5-1.2 | 0.2-0.5 | 0.3-0.4 |
| Pedro Sancho Moraga | 5 | 1.5 | 0.0 | 0.0 | 0.0 | 0.0 | 0.3 | 0.5-1.2 | 0.2-0.5 | 0.3-0.4 |
| Casey Jones | 5 | 1.4 | 0.6 | 0.7 | 0.1 | 0.2 | 0.4 | 0.4-1.0 | 0.2-0.5 | 0.3-0.5 |
| Team | 200 | 69.3 | 31.1 | 13.8 | 7.0 | 2.9 | 13.4 | 25.7-62.0 | 9.3-25.9 | 8.7-12.3 |
Duquesne simulated box score
| Player | MIN | PTS | REB | AST | STL | BLK | TO | FG | 3PT | FT |
|---|
| Tarence Guinyard | 39 | 17.9 | 5.3 | 4.1 | 1.8 | 0.0 | 2.4 | 5.8-12.6 | 2.4-6.6 | 4.0-5.6 |
| Yoav Berman | 35 | 14.3 | 7.0 | 3.2 | 1.3 | 0.5 | 1.2 | 4.9-10.0 | 1.7-4.6 | 2.7-3.7 |
| Josh Smith | 32 | 17.8 | 4.9 | 1.5 | 1.6 | 0.2 | 2.1 | 5.9-12.8 | 2.3-6.3 | 3.7-5.1 |
| Brandon Hall | 22 | 5.7 | 2.6 | 1.4 | 0.9 | 0.5 | 1.4 | 2.1-4.6 | 0.9-2.5 | 0.8-1.1 |
| Jake DiMichele | 17 | 6.7 | 1.4 | 1.7 | 0.6 | 0.2 | 0.5 | 2.4-5.3 | 1.0-2.8 | 1.0-1.3 |
| Ege Demir | 11 | 2.9 | 4.5 | 0.9 | 0.1 | 1.4 | 0.9 | 1.1-2.1 | 0.2-0.4 | 0.5-0.7 |
| Kerem Konan | 10 | 4.1 | 3.8 | 0.7 | 0.4 | 0.2 | 0.9 | 1.4-2.6 | 0.3-0.7 | 1.1-1.6 |
| Izaiah Pasha | 10 | 3.3 | 1.6 | 1.0 | 0.4 | 0.1 | 0.8 | 1.2-2.6 | 0.4-1.1 | 0.5-0.7 |
| Stephen Olowoniyi | 6 | 2.1 | 1.0 | 0.2 | 0.5 | 0.5 | 0.5 | 0.5-1.1 | 0.1-0.4 | 0.9-1.3 |
| Arness Lawson | 5 | 1.7 | 1.3 | 0.0 | 0.6 | 0.2 | 0.2 | 0.6-1.3 | 0.1-0.4 | 0.2-0.3 |
| Chaim Galbut | 5 | 1.5 | 0.0 | 0.0 | 0.0 | 0.0 | 0.2 | 0.5-1.0 | 0.2-0.4 | 0.3-0.4 |
| Dimitrios Ntapsis | 5 | 1.5 | 0.0 | 0.0 | 0.0 | 0.0 | 0.3 | 0.5-1.0 | 0.2-0.4 | 0.3-0.4 |
| Frederik Jellum | 5 | 1.4 | 0.0 | 0.0 | 0.0 | 0.0 | 0.3 | 0.5-1.0 | 0.1-0.4 | 0.3-0.4 |
| Team | 200 | 80.9 | 33.4 | 14.7 | 8.2 | 3.8 | 11.7 | 27.4-58.0 | 9.9-27.0 | 16.3-22.6 |
Every possession played out from each team's shooting, turnovers, rebounding and pace and each player's minutes and usage, 10,000 times. Early season: leans on last season until teams have a few weeks of games.


 WSUDUQ