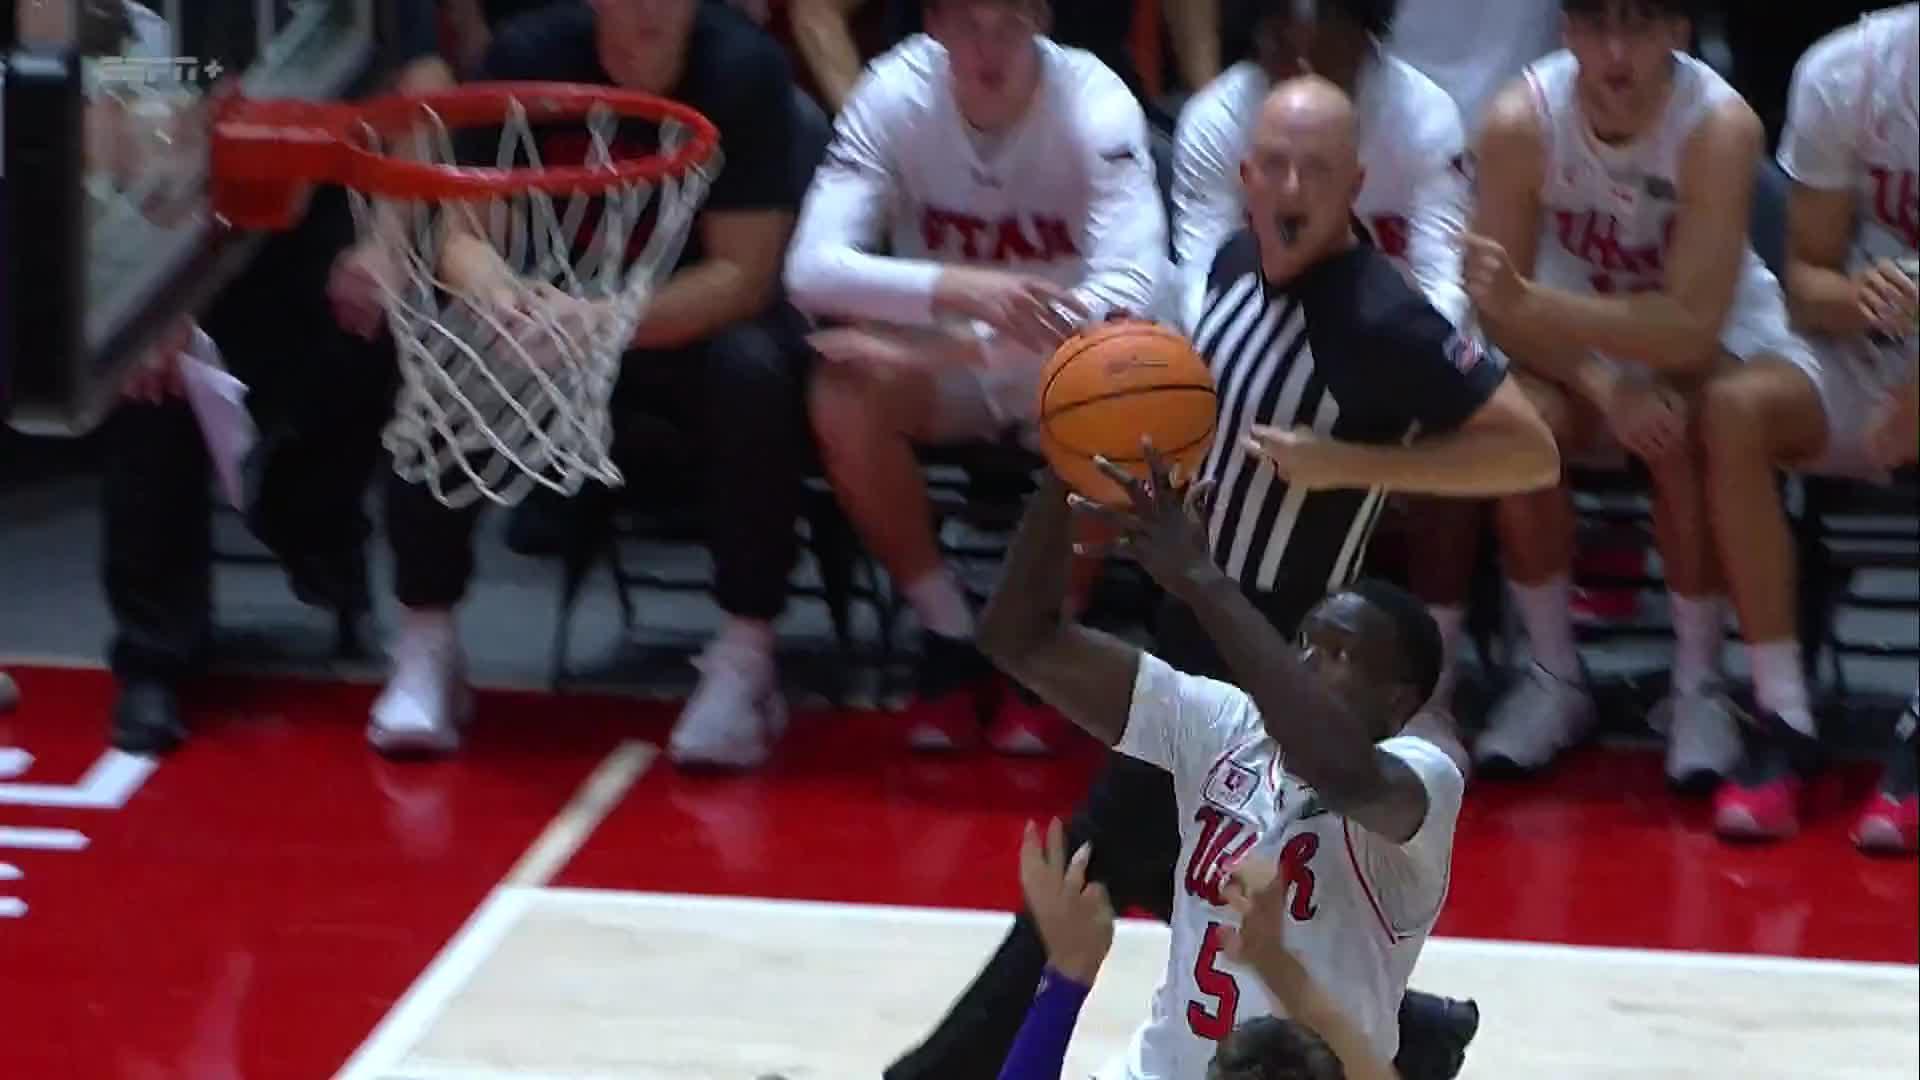
Washington Huskies vs Utah Utes
Leaders
Points
Nikola Dzepina
15.0
Alec Anigbata
14.7
Assists

Ryan Beasley
5.0
Trey Campbell
8.0
Rebounds
Ryan Beasley
7.5
Malek Gomma
6.0
Washington Huskies
2-0
Players to watch
Best Chirp Rating this season
Washington Huskies
2-0
Best Chirp Rating this season
Utah has won 3 straight.
10,000 simulated games
50%
WASH win
50%
UTAH win
Typical final
WASH 75, UTAH 76
Combined points
151
| Players to watch | PTS | REB | AST | Chance |
|---|---|---|---|---|
| UTAHTrey Campbell | 14.7 | 4.4 | 5.1 | 15+ 49% |
| UTAHAlec Anigbata | 13.8 | 4.1 | 1.6 | 15+ 42% |
| UTAHJackson Holcombe | 13.8 | 5.9 | 2.1 | 15+ 42% |
| WASHWesley Yates III | 12.2 | 3.2 | 1.7 | 15+ 31% |
| WASHLeJuan Watts | 11.6 | 6.9 | 2.9 | 15+ 26% |
| WASHRyan Beasley | 11.3 | 6.3 | 4.0 | 15+ 26% |
| Player | MIN | PTS | REB | AST | STL | BLK | TO | FG | 3PT | FT |
|---|---|---|---|---|---|---|---|---|---|---|
| Ryan Beasley | 33 | 11.3 | 6.3 | 4.0 | 1.5 | 0.1 | 1.5 | 4.0-9.7 | 1.7-5.1 | 1.7-2.3 |
| Wesley Yates III | 31 | 12.2 | 3.2 | 1.7 | 1.2 | 0.6 | 1.0 | 4.3-11.0 | 2.1-6.6 | 1.6-2.3 |
| LeJuan Watts | 27 | 11.6 | 6.9 | 2.9 | 0.9 | 0.2 | 2.0 | 3.5-8.0 | 0.9-2.9 | 3.7-5.0 |
| Parker Friedrichsen | 25 | 11.0 | 2.6 | 1.3 | 0.7 | 0.0 | 0.9 | 3.9-9.8 | 2.0-5.9 | 1.3-1.8 |
| Tayshawn Comer | 25 | 7.9 | 3.2 | 3.0 | 1.1 | 1.1 | 1.5 | 2.9-6.8 | 1.1-3.1 | 1.1-1.5 |
| Harun Zrno | 19 | 5.7 | 2.2 | 0.5 | 0.6 | 0.0 | 0.8 | 2.1-5.1 | 0.9-2.9 | 0.6-0.9 |
| Steele Venters | 15 | 6.2 | 2.5 | 0.3 | 0.6 | 0.0 | 0.7 | 2.4-6.1 | 1.3-3.9 | 0.2-0.3 |
| Lathan Sommerville | 15 | 5.1 | 3.5 | 0.1 | 0.4 | 0.6 | 1.2 | 1.6-3.6 | 0.3-1.1 | 1.4-2.0 |
| Nikola Dzepina | 9 | 4.1 | 2.3 | 0.4 | 0.2 | 0.6 | 0.4 | 1.5-3.3 | 0.4-1.2 | 0.8-1.1 |
| Team | 200 | 75.1 | 32.7 | 14.2 | 7.2 | 3.2 | 10.0 | 26.2-63.4 | 10.7-32.7 | 12.4-17.2 |
| Player | MIN | PTS | REB | AST | STL | BLK | TO | FG | 3PT | FT |
|---|---|---|---|---|---|---|---|---|---|---|
| Trey Campbell | 37 | 14.7 | 4.4 | 5.1 | 1.6 | 0.1 | 2.1 | 5.2-12.0 | 2.0-6.0 | 2.3-3.2 |
| Alec Anigbata | 32 | 13.8 | 4.1 | 1.6 | 0.0 | 0.6 | 1.0 | 3.6-8.4 | 1.4-4.1 | 5.2-7.1 |
| Jackson Holcombe | 30 | 13.8 | 5.9 | 2.1 | 1.2 | 1.3 | 2.5 | 4.9-10.2 | 1.0-3.1 | 2.9-4.1 |
| Malek Gomma | 26 | 6.5 | 6.3 | 1.1 | 0.2 | 0.2 | 1.4 | 2.3-4.7 | 0.4-1.1 | 1.6-2.5 |
| TJ Burch | 23 | 9.2 | 3.0 | 2.4 | 1.7 | 0.3 | 1.3 | 3.2-7.6 | 1.1-3.2 | 1.6-2.3 |
| Taison Chatman | 20 | 7.1 | 2.0 | 1.7 | 0.9 | 0.3 | 1.7 | 2.5-5.9 | 1.1-3.3 | 0.9-1.3 |
| Jaxon Johnson | 17 | 4.2 | 5.8 | 0.0 | 0.3 | 0.3 | 0.7 | 1.6-3.4 | 0.3-0.9 | 0.7-1.0 |
| Babacar Faye | 10 | 3.5 | 1.4 | 0.3 | 0.0 | 0.3 | 0.7 | 1.4-3.0 | 0.4-1.0 | 0.5-0.7 |
| Zati Loubaki | 6 | 2.4 | 1.1 | 0.0 | 0.3 | 0.0 | 0.4 | 0.9-2.0 | 0.3-0.8 | 0.4-0.5 |
| Team | 200 | 75.2 | 34.0 | 14.3 | 6.2 | 3.4 | 11.8 | 25.6-57.2 | 8.0-23.5 | 16.1-22.7 |
Every possession played out from each team's shooting, turnovers, rebounding and pace and each player's minutes and usage, 10,000 times. Early season: leans on last season until teams have a few weeks of games.