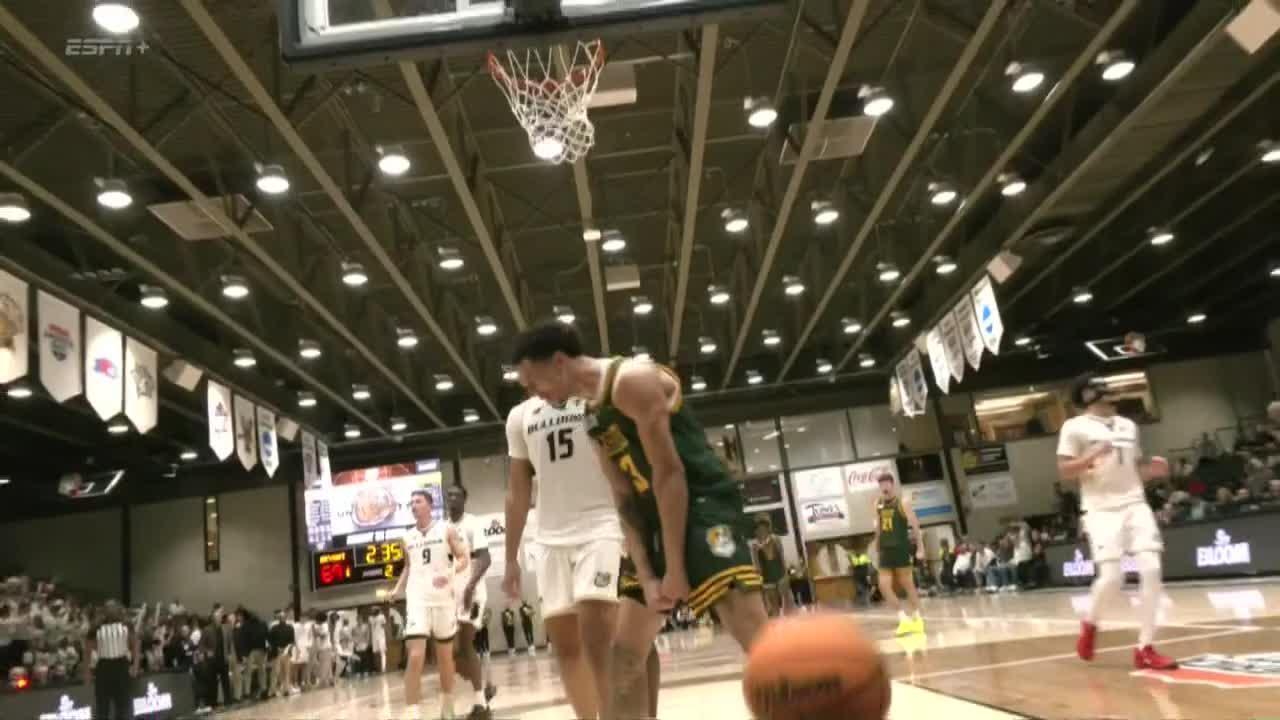
Bryant Bulldogs vs Quinnipiac Bobcats, America East-Metro Challenge


Leaders
 BRYQUIN

Points

Keegan Harvey
20.0
Tayeshawn Cunningham-Pemberton
11.0
Assists

Ty Tabales
5.0

Tai Turnage
5.0
Rebounds
Keegan Harvey
12.0

Keith McKnight
6.0
BRYQUIN 10,000 simulated games
48%
BRY win
52%
QUIN win
Typical final
BRY 72, QUIN 73
Combined points
145
| Players to watch | PTS | REB | AST | Chance |
|---|---|---|---|---|
| QUINKeith McKnight | 20.6 | 11.0 | 1.7 | 20+ 55% |
| BRYAndre Pasha | 16.4 | 9.7 | 2.6 | 20+ 28% |
| BRYKeegan Harvey | 16.4 | 9.9 | 1.4 | 20+ 28% |
| BRYTy Tabales | 15.5 | 4.4 | 4.0 | 15+ 55% |
| QUINNate Guerengomba | 9.1 | 1.5 | 0.5 | 10+ 43% |
| QUINHolden Pierre-Louis | 8.1 | 5.5 | 2.2 | 10+ 34% |
| Player | MIN | PTS | REB | AST | STL | BLK | TO | FG | 3PT | FT |
|---|---|---|---|---|---|---|---|---|---|---|
| Andre Pasha | 47 | 16.4 | 9.7 | 2.6 | 1.6 | 1.8 | 3.2 | 6.6-14.8 | 1.8-5.7 | 1.4-1.9 |
| Ty Tabales | 41 | 15.5 | 4.4 | 4.0 | 1.8 | 0.1 | 4.5 | 4.9-12.0 | 2.1-6.6 | 3.7-5.2 |
| Keegan Harvey | 39 | 16.4 | 9.9 | 1.4 | 0.2 | 1.2 | 3.6 | 5.6-12.0 | 1.4-4.2 | 3.7-5.2 |
| Eric Chatfield Jr. | 19 | 5.6 | 1.7 | 1.9 | 0.9 | 0.0 | 1.3 | 2.2-4.9 | 0.7-2.0 | 0.7-0.9 |
| Duane Thompson | 6 | 2.6 | 1.2 | 0.2 | 0.5 | 0.0 | 0.1 | 0.9-2.1 | 0.3-0.8 | 0.6-0.8 |
| Roi Behar | 6 | 2.4 | 0.2 | 0.7 | 0.0 | 0.0 | 0.1 | 0.8-1.9 | 0.3-0.9 | 0.5-0.7 |
| Elijah Crispin | 6 | 2.2 | 3.3 | 0.0 | 3.2 | 0.0 | 0.2 | 0.8-1.9 | 0.3-0.8 | 0.3-0.4 |
| Elijah Hayeems | 6 | 2.0 | 1.5 | 0.6 | 0.0 | 0.0 | 0.3 | 0.8-1.8 | 0.2-0.7 | 0.1-0.2 |
| Thor Grissom | 6 | 1.9 | 0.0 | 0.0 | 0.0 | 0.0 | 0.3 | 0.6-1.4 | 0.2-0.6 | 0.4-0.6 |
| Reed Woerner | 6 | 1.9 | 0.0 | 0.0 | 0.0 | 0.0 | 0.3 | 0.7-1.4 | 0.2-0.6 | 0.4-0.6 |
| Grady Payton | 6 | 1.9 | 0.0 | 0.0 | 0.0 | 0.0 | 0.3 | 0.6-1.4 | 0.2-0.6 | 0.4-0.6 |
| Connor Lyons | 6 | 1.8 | 0.0 | 2.7 | 0.0 | 0.0 | 0.2 | 0.7-1.5 | 0.2-0.6 | 0.3-0.4 |
| Tim Nwankwo | 6 | 1.8 | 0.0 | 0.0 | 0.0 | 0.0 | 0.3 | 0.6-1.4 | 0.2-0.6 | 0.4-0.6 |
| Team | 200 | 72.4 | 31.9 | 14.1 | 8.2 | 3.1 | 14.7 | 25.8-58.5 | 8.1-24.7 | 12.9-18.1 |
| Player | MIN | PTS | REB | AST | STL | BLK | TO | FG | 3PT | FT |
|---|---|---|---|---|---|---|---|---|---|---|
| Keith McKnight | 44 | 20.6 | 11.0 | 1.7 | 2.9 | 0.8 | 2.7 | 7.1-15.0 | 1.3-3.9 | 5.1-7.6 |
| Holden Pierre-Louis | 28 | 8.1 | 5.5 | 2.2 | 0.5 | 1.3 | 3.5 | 2.8-6.0 | 0.7-2.0 | 1.9-2.9 |
| Nate Guerengomba | 25 | 9.1 | 1.5 | 0.5 | 1.4 | 0.1 | 1.7 | 3.4-8.1 | 1.5-4.4 | 0.8-1.2 |
| Tai Turnage | 23 | 7.9 | 3.0 | 5.8 | 0.7 | 0.0 | 1.2 | 2.5-5.9 | 1.0-2.9 | 2.0-2.8 |
| Nas Hart | 19 | 7.4 | 4.9 | 0.0 | 0.1 | 0.2 | 0.9 | 2.0-4.4 | 0.5-1.5 | 3.0-4.5 |
| Braylan Ritvo | 12 | 3.9 | 1.0 | 0.1 | 1.3 | 0.4 | 0.5 | 1.4-3.1 | 0.4-1.2 | 0.7-1.0 |
| Tayeshawn Cunningham-Pemberton | 7 | 3.1 | 0.4 | 0.4 | 0.9 | 0.0 | 0.6 | 1.1-2.5 | 0.3-1.0 | 0.5-0.7 |
| Lucas Sekasi | 7 | 2.8 | 0.0 | 1.5 | 0.4 | 0.0 | 0.3 | 0.7-1.6 | 0.2-0.6 | 1.1-1.6 |
| Nedas Cholevinskas | 7 | 2.6 | 1.4 | 0.0 | 0.0 | 0.0 | 0.4 | 1.0-2.4 | 0.4-1.1 | 0.2-0.2 |
| Malik Fields | 7 | 2.3 | 0.0 | 0.0 | 0.0 | 0.0 | 0.4 | 0.8-1.8 | 0.2-0.7 | 0.5-0.7 |
| Jayden Reid | 7 | 2.3 | 0.0 | 0.0 | 0.0 | 0.0 | 0.7 | 0.8-2.0 | 0.3-0.8 | 0.3-0.4 |
| Ali Diouf | 7 | 1.9 | 0.2 | 0.4 | 0.0 | 0.4 | 0.5 | 0.7-1.6 | 0.2-0.6 | 0.2-0.3 |
| Mike Parrotta | 7 | 1.6 | 1.4 | 0.7 | 0.8 | 0.0 | 0.3 | 0.6-1.2 | 0.2-0.5 | 0.4-0.5 |
| Team | 200 | 73.6 | 30.3 | 13.3 | 9.0 | 3.2 | 13.7 | 24.9-55.6 | 7.2-21.2 | 16.7-24.4 |
Every possession played out from each team's shooting, turnovers, rebounding and pace and each player's minutes and usage, 10,000 times. Early season: leans on last season until teams have a few weeks of games.
| Player | Stat | Line | Sim | Gap | Sim says | Last 10 | Last 5 |
|---|---|---|---|---|---|---|---|
| Keegan HarveyBRY @ QUIN · Thu 7:00 PM | Pts + Reb + Ast | 22.5 | 27.7 | +5.2 | Over 59% | 7/10 |
Where the sim and his last 10 games agree. His line is the number he went over in about half of his last 20 games.