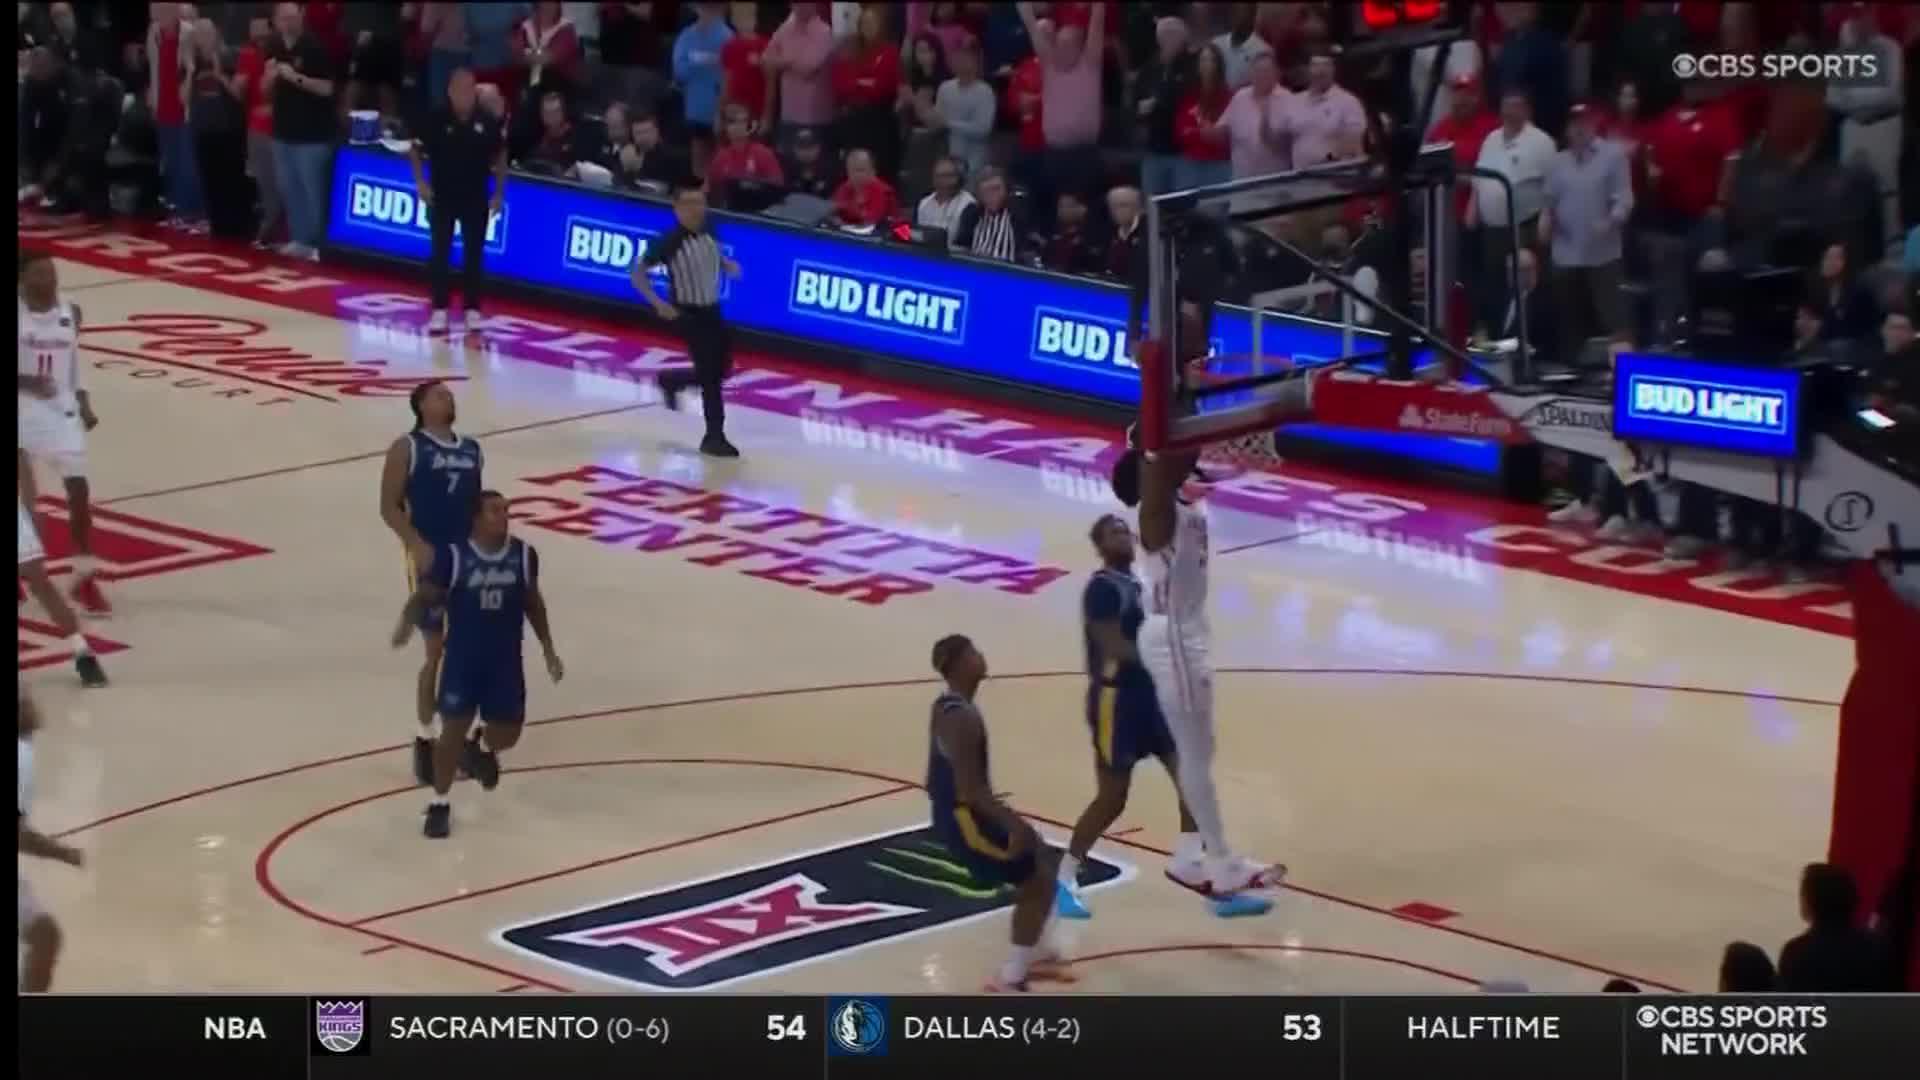
Long Island University Sharks vs La Salle Explorers


Leaders
 LIULAS

Points

Daquan Davis
16.0

Kam Burton
15.0
Assists

Vasean Allette
5.0
RJ Smith
5.0
Rebounds

Tyrell Bowles
11.0

Bowyn Beatty
7.0
LIULAS 10,000 simulated games
49%
LIU win
51%
LAS win
Typical final
LIU 72, LAS 73
Combined points
145
| Players to watch | PTS | REB | AST | Chance |
|---|---|---|---|---|
| LIUJosh Pickett | 14.0 | 4.4 | 4.3 | 15+ 44% |
| LASRob Dockery | 12.6 | 8.3 | 2.5 | 15+ 33% |
| LIUJustin Johnson | 11.7 | 6.4 | 1.7 | 15+ 27% |
| LASJamison Lynam | 10.3 | 3.1 | 0.0 | 10+ 53% |
| LASJaden Johnson | 10.3 | 2.6 | 4.4 | 10+ 54% |
| LASJerome Brewer Jr. | 10.3 | 4.9 | 0.9 | 10+ 54% |
| Player | MIN | PTS | REB | AST | STL | BLK | TO | FG | 3PT | FT |
|---|---|---|---|---|---|---|---|---|---|---|
| Josh Pickett | 49 | 14.0 | 4.4 | 4.3 | 0.8 | 0.1 | 2.7 | 4.8-11.6 | 2.3-6.9 | 2.2-3.1 |
| Justin Johnson | 28 | 11.7 | 6.4 | 1.7 | 1.2 | 0.3 | 2.5 | 4.1-9.3 | 1.2-3.6 | 2.3-3.3 |
| Kamari Jones | 20 | 9.0 | 1.6 | 0.3 | 0.3 | 0.0 | 0.9 | 3.2-7.8 | 1.5-4.6 | 1.0-1.4 |
| Daquan Davis | 17 | 8.7 | 2.1 | 0.9 | 1.1 | 0.0 | 2.8 | 3.5-7.5 | 0.8-2.5 | 0.9-1.3 |
| Deshawn Jean-Charles | 16 | 6.4 | 2.0 | 0.0 | 0.9 | 0.0 | 1.1 | 1.9-4.3 | 0.6-1.9 | 2.0-2.8 |
| Max Ndlovu-Fraser | 14 | 4.3 | 1.6 | 1.6 | 1.3 | 0.0 | 1.0 | 1.5-3.4 | 0.5-1.4 | 0.8-1.2 |
| Jahki Howard | 12 | 3.7 | 1.0 | 0.1 | 0.0 | 0.0 | 1.3 | 1.4-3.0 | 0.4-1.2 | 0.7-0.9 |
| Vasean Allette | 7 | 3.4 | 0.4 | 2.4 | 1.6 | 0.0 | 0.8 | 1.2-2.6 | 0.3-0.9 | 0.6-0.9 |
| Travis Triplett Jr. | 7 | 2.5 | 0.0 | 0.0 | 0.0 | 0.0 | 0.4 | 0.8-1.8 | 0.2-0.7 | 0.6-0.8 |
| Ryan Bewley | 7 | 2.5 | 4.2 | 0.7 | 0.8 | 1.4 | 0.2 | 0.5-1.1 | 0.2-0.5 | 1.4-2.0 |
| Joshua Skinner | 7 | 2.2 | 2.1 | 0.0 | 0.0 | 0.0 | 0.7 | 0.8-1.9 | 0.3-0.8 | 0.3-0.4 |
| Matt Bewley | 7 | 2.1 | 2.9 | 0.0 | 0.0 | 1.2 | 0.2 | 0.8-1.8 | 0.2-0.7 | 0.3-0.4 |
| Tyrell Bowles | 7 | 2.0 | 4.0 | 0.8 | 0.0 | 0.2 | 0.1 | 0.4-0.9 | 0.1-0.3 | 1.1-1.6 |
| Team | 200 | 72.5 | 32.7 | 12.8 | 8.0 | 3.2 | 14.7 | 24.9-57.0 | 8.6-26.0 | 14.2-20.1 |
| Player | MIN | PTS | REB | AST | STL | BLK | TO | FG | 3PT | FT |
|---|---|---|---|---|---|---|---|---|---|---|
| Jamison Lynam | 31 | 10.3 | 3.1 | 0.0 | 1.3 | 0.0 | 1.6 | 3.6-8.1 | 1.1-3.2 | 2.1-2.9 |
| Jaden Johnson | 30 | 10.3 | 2.6 | 4.4 | 0.9 | 0.0 | 1.9 | 3.4-8.2 | 1.2-3.8 | 2.3-3.3 |
| Rob Dockery | 27 | 12.6 | 8.3 | 2.5 | 1.6 | 0.3 | 4.4 | 3.8-8.3 | 0.8-2.3 | 4.1-5.7 |
| Jerome Brewer Jr. | 27 | 10.3 | 4.9 | 0.9 | 0.8 | 0.3 | 1.1 | 3.8-8.6 | 1.1-3.4 | 1.7-2.4 |
| Vice Zanki | 21 | 8.0 | 2.8 | 1.4 | 1.1 | 0.1 | 0.7 | 3.0-7.4 | 1.3-4.1 | 0.6-0.8 |
| Anthony Finkley | 19 | 6.1 | 2.6 | 1.4 | 0.5 | 0.4 | 1.3 | 2.1-5.1 | 0.9-2.8 | 1.0-1.4 |
| Kam Burton | 19 | 8.3 | 1.9 | 0.2 | 0.7 | 0.0 | 0.6 | 2.7-7.0 | 1.6-4.8 | 1.3-1.8 |
| Noah Collier | 14 | 4.1 | 2.8 | 2.0 | 1.5 | 1.3 | 1.2 | 0.9-1.9 | 0.3-0.8 | 2.2-3.1 |
| Eunique Rink | 12 | 3.1 | 2.1 | 0.2 | 0.4 | 0.7 | 0.6 | 1.1-2.4 | 0.3-0.9 | 0.6-0.9 |
| Team | 200 | 73.1 | 31.1 | 13.0 | 8.8 | 3.1 | 13.4 | 24.4-57.0 | 8.6-26.1 | 15.9-22.3 |
Every possession played out from each team's shooting, turnovers, rebounding and pace and each player's minutes and usage, 10,000 times. Early season: leans on last season until teams have a few weeks of games.